Overview
The CrashPlan Dashboards display an in-depth, complete summary of your CrashPlan environment.
For details about all features of the CrashPlan console, see CrashPlan console overview.
Navigation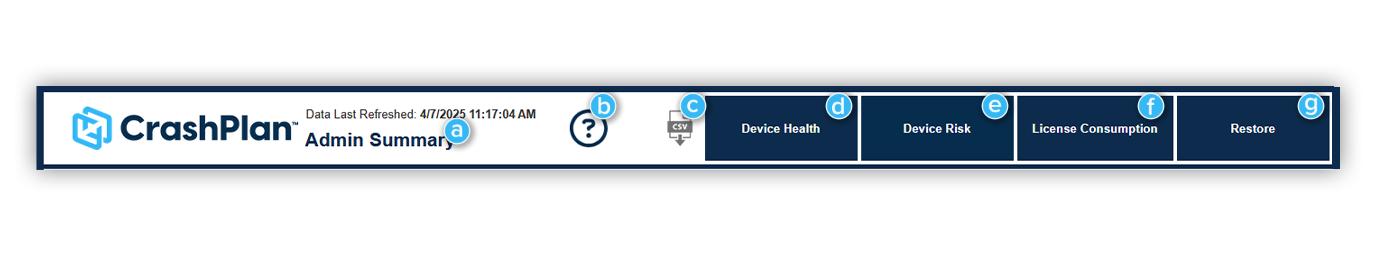
| Item | Description | |
| a | Dashboard tab title | The name of the dashboard tab you are presently on. By default, this is the Admin Summary when you open the dashboard. |
| b | Help link icon | Wherever this icon appears, click to open a link to our support site for reference information. |
| c | CSV download | Download a dashboard area to a CSV or Excel. You can select a dashboard area (such as Cold Storage) and select either CSV or Excel format to download. |
| d | Device Health | Dashboard outlining health metrics for devices in your organization. |
| e | Device Risk | Dashboard for evaluating the risk of common backup problems in your organization. |
| f | License Consumption | Dashboard that helps see where your licenses are used and how. |
| g | Restore | Dashboard to examine restore usage, size, and more. |
Many areas of the dashboards offer the option to filter or further refine results. To return to default values and views, simply reload the page.
Data refreshes every 24 hours
Recent changes to your organization may not immediately be reflected in these dashboards.
Admin Summary
This is the main dashboard you'll see when you first come to the Dashboards area. It's main purpose is to provide a high-level overview of your environment, but you can interact with sections of the dashboard to investigate a particular parameter.
| Item | Description | |
| a | Used Licenses |
Shows the number of licenses used out of number of licenses purchased. Hovering over the Used Licenses area will bring up a bar chart showing historical data for licenses used, licenses purchased, and percent of licenses in use. |
| b | Restores |
Shows the number of restores performed in your CrashPlan environment and total amount of data restored in terabytes. Hovering over the Restores area will bring up a bar chart showing historical data for the number of restores and amount of data restored. |
| c | Files Protected | Shows the number of discrete files selected for backup in your environment across all users and devices. |
| d | Data Protected |
The total size of data backed up in your environment. Hovering over the Data Protected area will show the average archive size for devices (GB) , as well as the average archive size per user (GB). |
| e | Device Connection Breakdown |
Shows the number of devices that have connected in the span of the previous 30 days. Hover over a column in the graph will give the exact count of devices for the category, as well as what percentage of total devices it encompasses. |
| f | Supported CrashPlan Client |
Shows the number of devices that are running a supported version of the CrashPlan app. Hovering over a section of the graph will show the exact count of devices in the category. |
| g | Users Connected in Last 30 Days |
Shows the number of devices that haven't connected within 30 days. Hovering over the graph will show the exact count of devices in the category. |
| h | User Role Summary |
A table listing types of roles and how many users with those roles exist in your environment. For more information, see our article on managing user roles. |
| i | Number of Users in Legal Hold Matters | Shows the number of users currently in a legal hold. |
| j | Number of Computers in Legal Hold Matters | Shows the number of users currently in a legal hold. |
Device Health
This dashboard is intended to help you quickly identify and address problem areas within your organization.
How is device health evaluated?
We use several criteria to help determine device health.
- Few Files: A device has a small number of files in its file selection.
- Few Data: A device has a small amount of data selected to back up in its file selection.
- Small Archive: A device has a small amount of data stored in its backup archive.
Each backup is unique, so only having a few files selected could be an issue on one device but normal on another device. To help administrators pinpoint devices that are unhealthy, we've created levels of importance for these issues based on the typical severity of each of the criteria, and whether a device meets several criteria concurrently.
High Issues
- Few Files, Few Data, and Small Archive
- Few Files, Few Data
Medium Issues
- Few Data, Small Archive
- Few Data
Low Issues
- Few Files
- Small Archive
| Item | Description | |
| a | Time Since Last Connected |
Shows a dropdown menu that allows you to filter the dashboard by time since devices have last connected. You can use this to narrow the scope of investigation, such as choosing 30 days to focus only on devices that have recently been in use. |
| b | Device Health Current | A chart showing a breakdown of issues in your environment, sorted by importance, issue type, and OS type. See the device health definition section for more information on issue type and classification. |
| c | Urgent Issues | Chart showing the number of computers in an organization with an urgent importance issue. See the device health definition section for more information on issue type and classification. |
| d | High Issues | Chart showing the number of computers in an organization with a high importance issue. See the device health definition section for more information on issue type and classification. |
| e | Medium Issues | Chart showing the number of computers in an organization with a medium importance issue. See the device health definition section for more information on issue type and classification. |
| f | Low Issues | Chart showing the number of computers in an organization with a low importance issue. See the device health definition section for more information on issue type and classification. |
| g | Issue Definitions |
An at-a-glance reference for interpreting the various parameters that contribute to device health. Different combinations of these issues make up the device health severity classification tiers. See the device health definition section for more information. |
| h | Device Health Table | Detailed information about users and devices with issues indicated in the Device Health Current (b) chart. |
Device Risk
This dashboard is intended to help you quickly identify organizations, users, and devices that are at-risk for common device health issues.
| Item | Description | |
| a | Time Since Last Connected |
Shows a dropdown menu that allows you to filter the dashboard by time since devices have last connected. You can use this to narrow the scope of investigation, such as choosing 30 days to focus only on devices that have recently been in use. |
| b | Unsupported Operating System |
This chart shows a summary of the number of devices running an unsupported operating system in each organization in your CrashPlan environment, broken down by operating system (Windows, macOS, and Linux). Hovering over a segment of a column will show the exact count of devices in that category. Clicking on a segment of a column will populate specific details in the Device Risks Lists (e) area for further investigation. |
| c | Unsupported CrashPlan Client |
This chart shows a summary of the number of devices running an unsupported version of the CrashPlan app in each organization in your CrashPlan environment, broken down by operating system (Windows, macOS, and Linux). Hovering over a segment of a column will show the exact count of devices in that category. Clicking on a segment of a column will populate specific details in the Device Risks Lists (e) area for further investigation. |
| d | Days Since Last Connected |
This chart shows a color-coded matrix of the number of devices, users, and the average number of days since devices were last connected. Each column can be sorted in ascending and descending order. The Grand Total row at the bottom shows the total number of devices and users in your environment (regardless of connection status) and a complete average of the number of days since last connected. |
| e | Device Risks List | This table will show detailed information for specific chart segments selected in the Unsupported Operating System (b) and Unsupported CrashPlan Client (c) sections of the dashboard, allowing for more granular investigation. |
| f | Duplicate Device Finder |
This table shows a list of devices in your environment that have the same device name, but different Computer GUID numbers, sorted by the user that they belong to. You can use this information to deactivate old, unused, or otherwise duplicate GUIDs from your environment. |
License Consumption
This dashboard is intended to give you an overview of how licenses are being consumed in your organization, as well as their status and history over time.
| Item | Description | |
| a | Org name | Chose a specific organization to filter the data specifically to the devices and users in that organization. By default, all organizations are selected. |
| b | Licenses History | A chart showing the usage of licenses over time, broken down by month. |
| c | License Consumption by Organization |
A chart showing the count of licenses consumed by each organization in your environment. Hovering over a bubble will show the organization name, the exact count of licenses consumed, and the total percentage of all licenses consumed that the segment comprises. This chart will change dynamically depending on if a particular organization and month is selected in the License History by Organization (d) chart. |
| d | License History by Organization |
A chart showing the count of licenses consumed by each organization in your environment, broken down by month. Hovering over a segment of the chart will show the name of the organization and exact count of licenses consumed during that month, and clicking a segment will update the License Consumption by Organization (c) chart for additional visualization. |
| e | Number of Computers by OS Type | A chart showing the number of computers in your environment, broken down by operating system. |
| f | License Usage |
A chart showing how many of your licenses are in use, expressed as a percentage. Hovering over a segment of the chart will show the total number of licenses consumed, licenses purchased, and the percentage of purchased licenses that segment consumes. |
Restore
This dashboard is intended to give you an overview of how CrashPlan is used to restore files in your environment, such as how often restores occur, who is restoring, and more.
| Item | Description | |
| a | Restore Start Date | Displays the last time the data on the page was refreshed. |
| b | Documentation | A button that links to this document for easy reference |
| c | Hide or show filters | Toggle to either hide or show the configurable dashboard filters (e) |
| d | CSV Download | Download a dashboard area to a CSV or Excel. You can select a dashboard area (such as Cold Storage) and select either CSV or Excel format to download. |
| e | Dashboard navigation | Quickly navigate to one of the other dashboards - Areas of Concern, License Consumption, and Usage. |
| f | Restore Start Date | Select a time frame to filter data shown in this dashboard. |
| g | Restore by Type |
A pie chart displaying a breakdown of restore types in your environment.
Hovering over sections of the chart will show the number of restores as well as the number of distinct users who have performed restores. Clicking a restore type below the chart will allow you to exclude that license type or show only that license type. |
| h | Data Restored Over Time |
A bar chart showing restore time frame, restore size, and restore count. Hovering over a bar will display restore count, distinct user restore count, and time frame. |
| i | Restore by Restore Time | A pie chart showing a summary of all restores, broken down by duration to complete. |
| j | Restore Information |
Each button populates the Usage Explorer (k) with different information based on the criteria selected.
|
| k | Usage Explorer | Detailed information about users, devices, roles, and restores based on the filter selected: Restore by User , Restore by Type, Restores by User Role, Top Users by Number of Restores, and Top Users by Amount Restored. |